Turning raw business data into clear, actionable insights
Helix Analytics helps enterprises structure, analyze, and visualize data - from cleaning and exploration to dashboards and forecasting.
Services
A complete analytics workflow tailored to your business needs.
Data Cleaning & Preparation
Feature engineering, missing value handling, structured datasets using Python & Power Query.
Exploratory Data Analysis
Deep exploration of trends, anomalies and business patterns using Python.
SQL Database Management
MS-SQL queries, optimization & integration with BI tools.
Dashboard Design (Power BI / Tableau)
Interactive dashboards for decision-makers with drilldowns & KPIs.
Excel-Based Reporting
Reports using pivots, formulas, automation & SQL connections.
Modeling & Forecasting
Forecasting & predictive analytics for future planning.
Our Work
Analysis, Dashboards and Data solutions delivered for learning and real-world problems.
✈️ Flight Price EDA (Python)
Exploratory data analysis using Pandas, NumPy and visualizations to identify pricing trends and support pricing strategy recommendations.
🍷 Wine Quality EDA (Python)
Analysed wine quality dataset to uncover correlations and present findings with clear visualizations.
📱 Google Play Store EDA (Python)
Analyzed app performance metrics and user trends to highlight drivers of ratings and downloads.
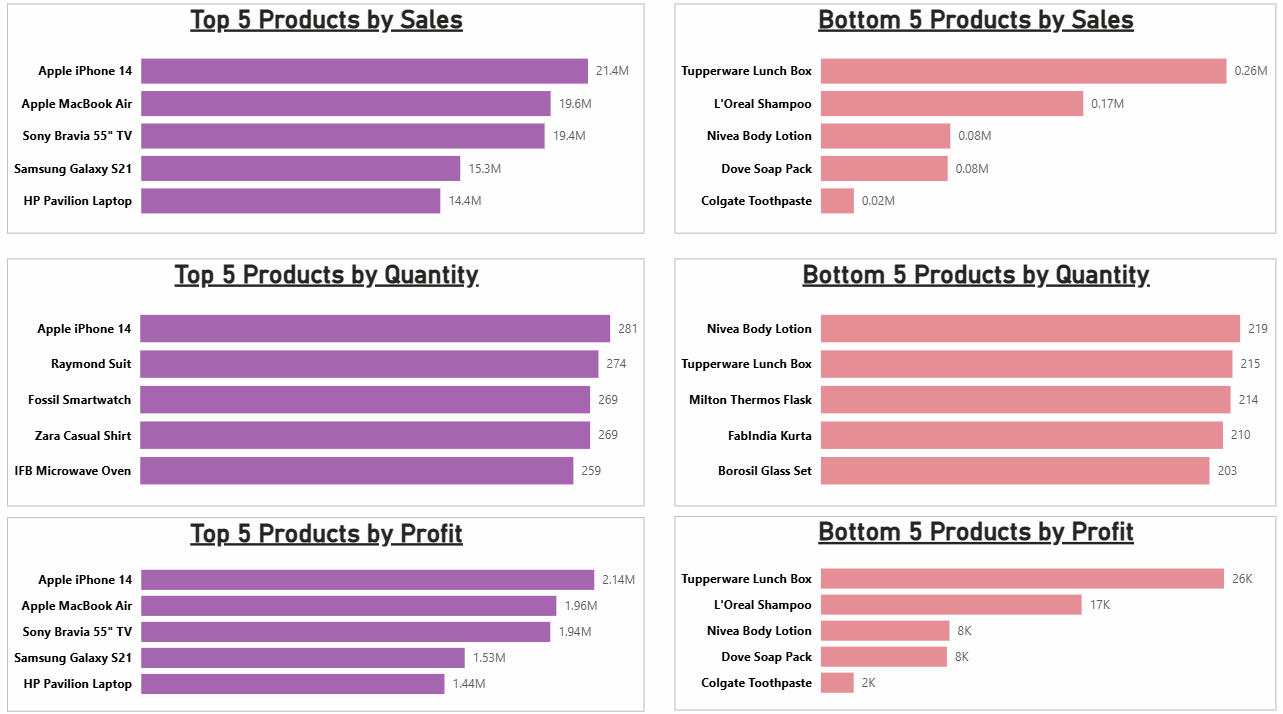
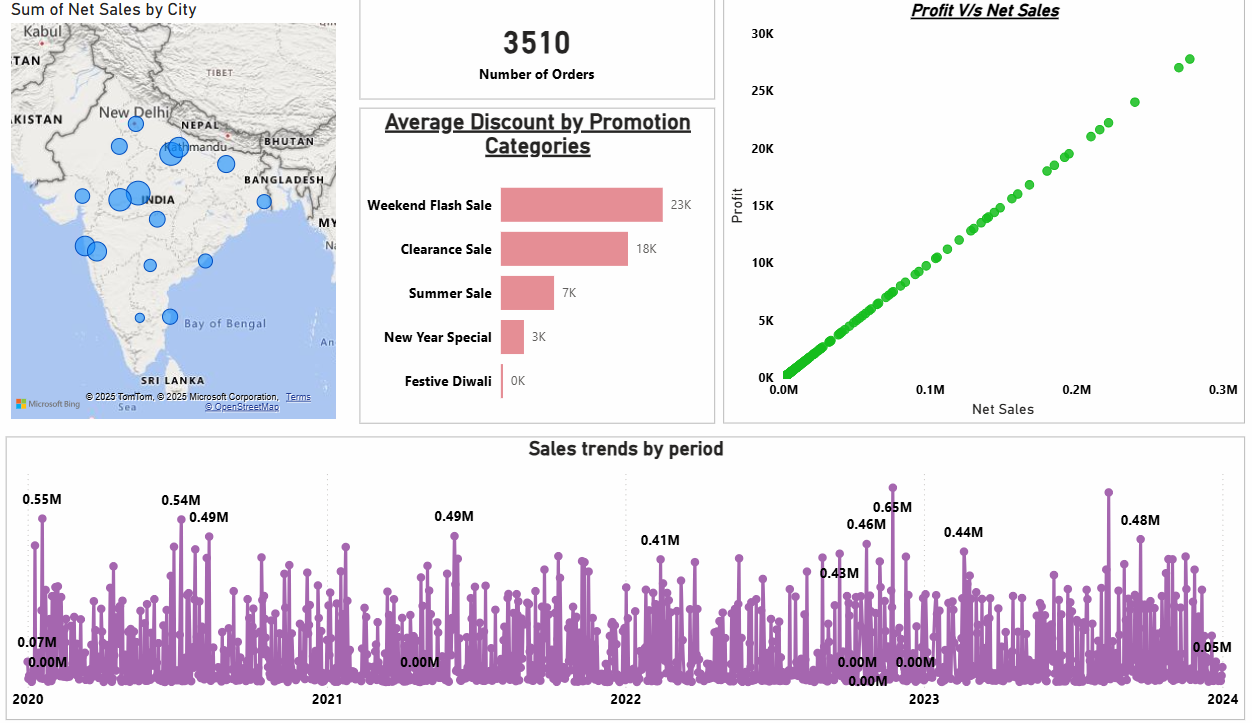
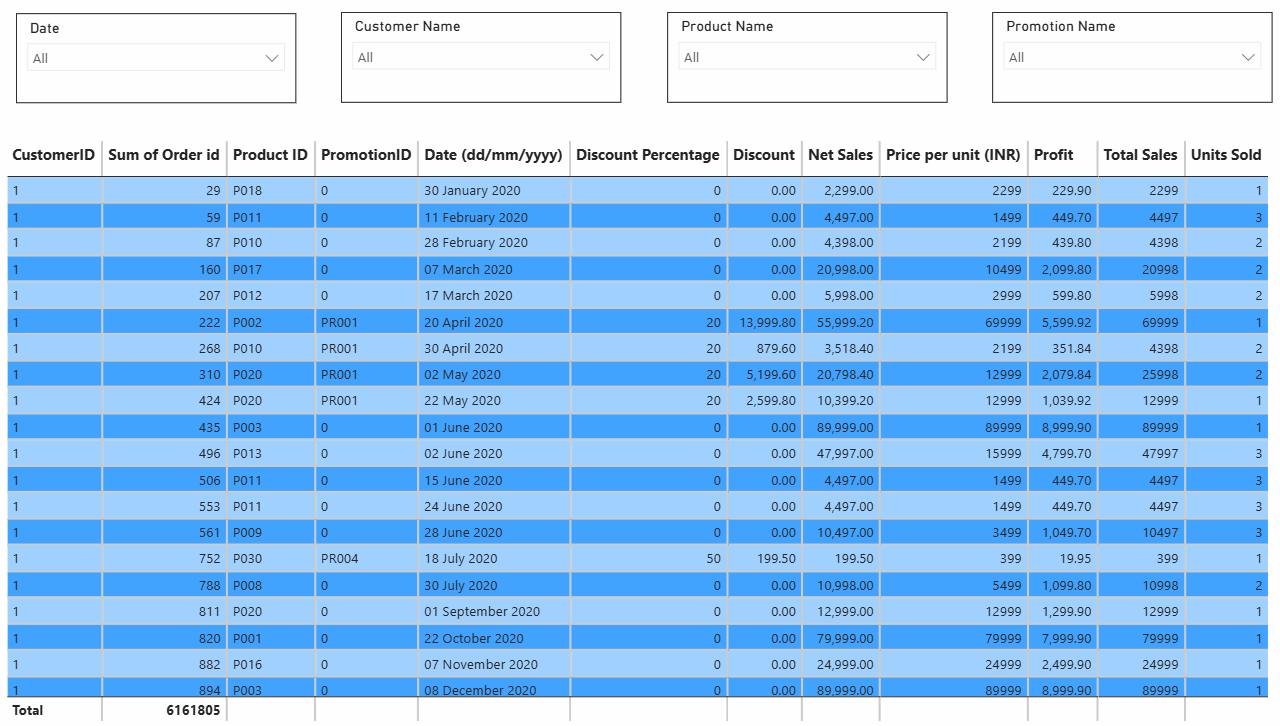
🛒 Sales Data Analysis (Power BI)
Interactive Power BI dashboard integrating multiple sources to present KPIs and growth opportunities.
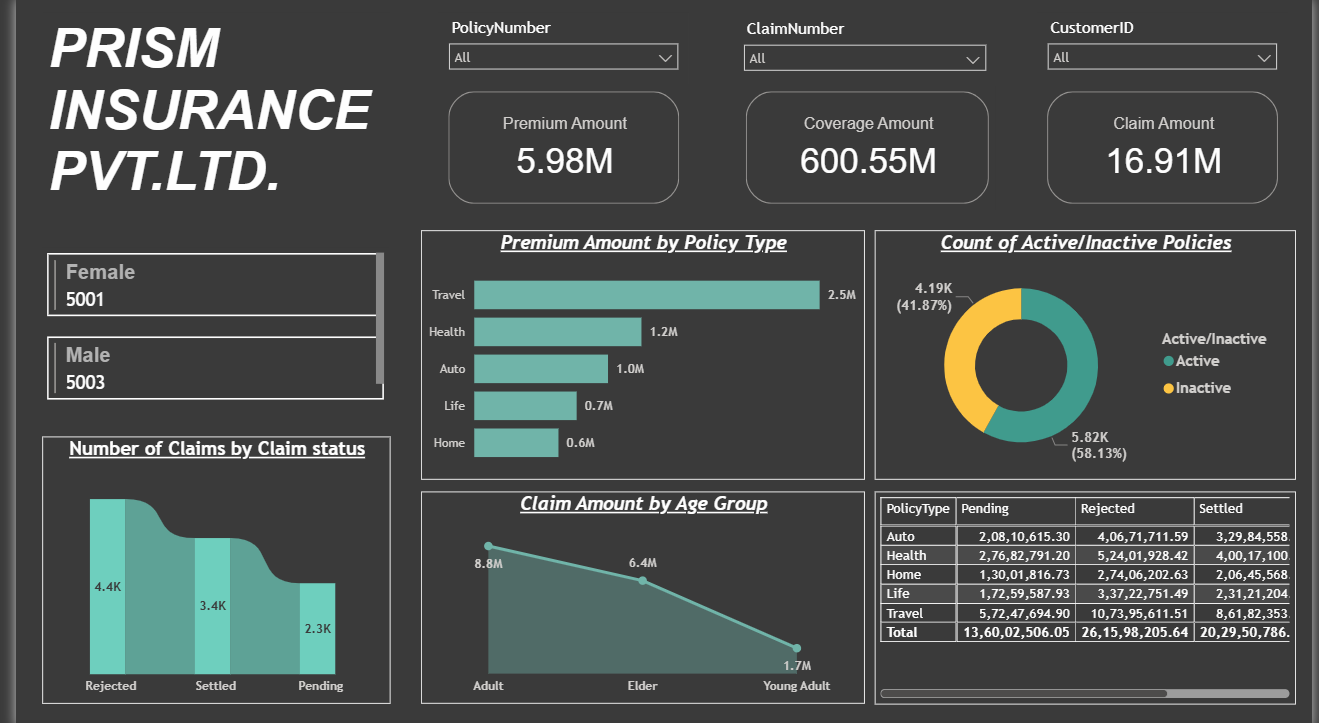
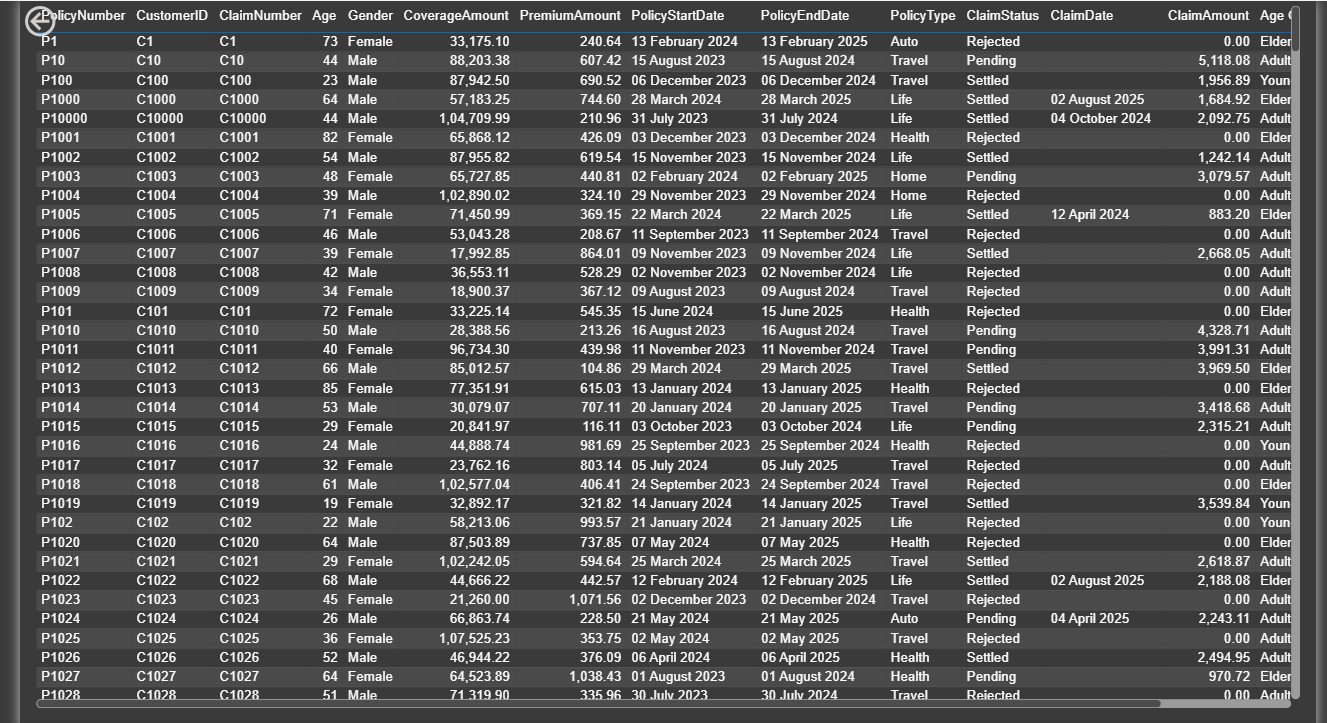
🏥 Insurance Data Analysis (Power BI)
Visualized insurance KPIs and trends for operational and strategic insights.
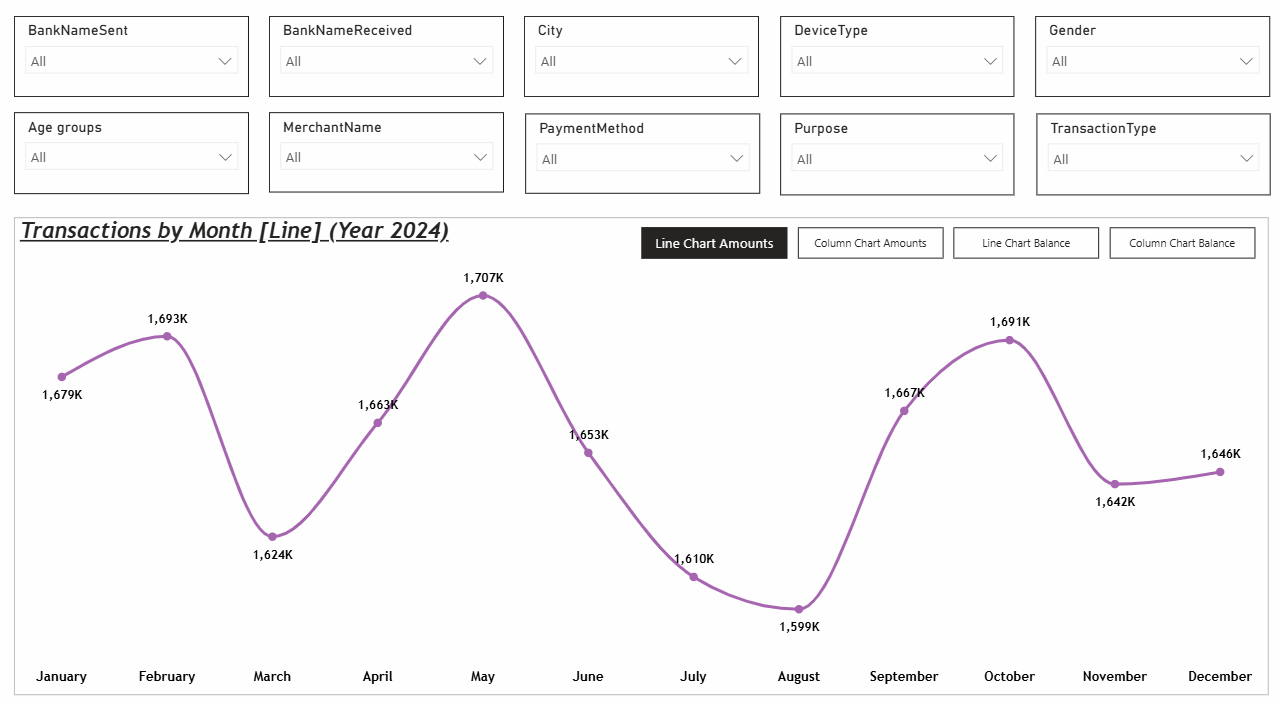
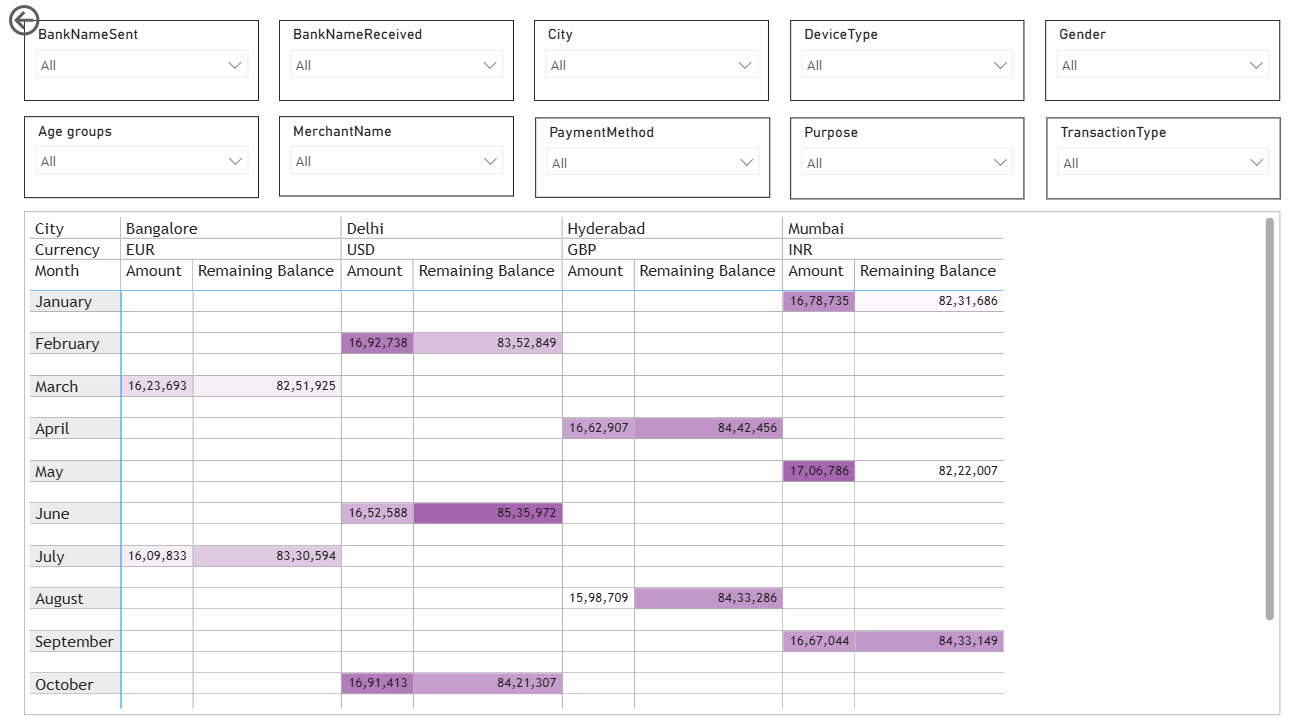
💳 UPI Transactions (Power BI & Tableau)
Dashboards to analyze transaction patterns across cities, age groups & payment methods.
📊 Excel Dashboards
Pivots & dashboards built in Excel to summarize raw data and present action-ready metrics.
🎓 Student Depression Analysis (SQL + Tableau)
Built visualizations to show relationships between academic pressure, study hours and well-being.
How we work
A clear, structured approach to solving business problems.
Meet the founder
Mr. Hitesh Jadhav is the Founder of Helix Analytics and a certified Data Analyst with a strong focus on modern data tools and techniques. He has built his expertise through extensive hands-on work in Python, Numpy, Pandas, Matplotlib, Seaborn, EDA, SQL, DAX, Snowflake, Power BI, Tableau, and Excel. His core strength lies in data visualisation where he creates clear, insightful dashboards using Power BI and Tableau to help businesses make better decisions. His analytical thinking is supported by his background in Mechanical Engineering, a field that strengthened his mathematical foundation and structured problem solving. Before moving fully into analytics, he also spent over three years in financial markets where he learned market behaviour, technical analysis, and data interpretation. These experiences now complement his work in analytics by giving him a practical understanding of how data influences real world decisions. Today, Mr. Jadhav focuses on transforming raw data into meaningful stories and delivering accurate, actionable insights for clients through Helix Analytics.
Contact
Reach out and we’ll respond with clear next steps & timelines.